top of page

Veterans United is the nation's leading VA home purchase lender and is based out of Columbia, Missouri. Fortune Magazine named VU the 32nd Best Company to Work For and the 9th Best Workplace for Millennials. I worked as a graphic design intern for the Quantitative Strategy team. The QS team works to improve complicated internal processes. It was my job to explain these processes and the solutions my team proposed by designing graphics pages meant for internal distribution. I also worked with the team to design a team logo and style.
 Explainer on the Quantitative Strategy team within Veterans United. |  Logo options presented to the Quantitative Strategy team. |
|---|---|
 Final logo chosen by Quantitative Strategy team. 2.72 = constant 'e' in mathematics |  First in a series of three. Explainer on the Kaplan-Meier Estimator. The QS team wants to predict when/if current loan processes will be completed successfully. |
 Second in a series of three. Explainer on the Kaplan-Meier Estimator. The Kaplan-Meier Estimator takes into account failed loan processes as well as completed ones, providing an accurate estimation for current processes. |  Third in a series of three. Explainer on the difference between the Kaplan-Meier Estimator and other lesser estimation systems. |
 First in a series of two. Explainer on the old system that Veterans United used to call leads throughout the day. The call system was modified during my time as an intern. |  Second in a series of two. Explainer on the new system that Veterans United will use to call leads throughout the day. |
 Explainer on the Lighthouse program within Veterans United. |  Explainer on the Quantitative Strategy team's process for bidding/advertising with search engines called Sparrow. |
 Explainer on four commonly-used applications at Veterans United. |  First in a series of three. VU sorts incoming leads using a queuing process, which was modified during my time as an intern. |
 Second in a series of three. Explainer that describes the old VU queuing system. |  Third in a series of three. Explainer that describes the new VU queuing system. |
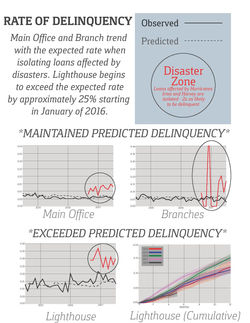 Graphs on natural disasters and the rate of delinquency, or the rate at which pursued leads do not receive successful loans. Calculations done by Quantitative Strategy team. |
bottom of page